发音 (Pronunciation):
IPA: /tʃɑːrts/
中文近似: '查茨'
中文意思与词性 (Meanings & Part of Speech):
- 图表 (n.)
- 图表制作 (v.)
例句 (Examples):
1. The sales charts show a significant increase this quarter.
(销售图表显示本季度有显著增长。)
2. She charts her progress in a notebook.
(她在笔记本中记录她的进展。)
用法提示 (Usage Tip):
注意区分 'chart' 和 'graph',二者虽然相似,但 'chart' 更侧重于组织和总结数据。
更多关于 "charts" (More about "charts")
单词来源 (Etymology)
该词源于古法语 'charte',意为“纸张”或“地图”,最初指的是绘制地图或图表的过程。
词根词缀解析 (Root & Affix Analysis)
该词是基础词,没有复杂的词根词缀。
“charts”的字母与词根个性化解读
字母象形/引申义 (个性化参考)
- 字母 'c' 的象形或引申含义可能包括: 骆驼头 (象形) -> 运输 (car); 抓 (手型); 砍 (弯刀); 包围 (形状); 合并; 叫喊 (嘴型); 走/动; 音变: C=G=K=S。
- 字母 'h' 的象形或引申含义可能包括: 梯子 (象形) -> 高, 大; 手 (hand, hold); 房子 -> 隐藏; 拟声 (送气音 哈气); 音变: H=G=K=C, H易脱落。
- 字母 'a' 的象形或引申含义可能包括: 牛角 (象形: 牛头, 力量, 能力); 下面宽上面尖 (形状) -> 延伸, 远处, 高处, 方向, 指示。
- 字母 'r' 的象形或引申含义可能包括: 直立, 向上 (字母R形); 走, 跑 (R象形人); 弯曲 (舌头卷曲); 音变: R=L=M=N。
- 字母 't' 的象形或引申含义可能包括: 顶端 -> 记号/标志; 手杖 -> 抓 -> 手 -> 伸展 -> 指示代词; 支撑 -> 站立; 三叉 -> Tr转换/转; 分叉; 音变: T=D=S=TH。
- 字母 's' 的象形或引申含义可能包括: 水波纹/走路痕迹 (S象形); 吐气轻细咝 -> 说话 (拟声); 音变: S=C=Z=TH=X。
词根/组合解读 (个性化参考)
- 单词中的片段 'ar' (源自词根/组合 'ar') — 含义: 手臂, 艺术; 弓, 弧形; 后缀:形容词/名词; (来源提示: a(伸长)+r(弯曲); ar(手臂)+c(弧形); 后缀).
学习提示:以上针对单词 charts 的字母和词根解读,主要基于提供的特定象形及词根资料。这些提示旨在启发联想,而非绝对定论。更通用的记忆规则和原则请参考首页。英语词源复杂多变,实际应用中请结合更全面的词源词典和语言学知识进行深入学习。
常用词组 (Common Phrases)
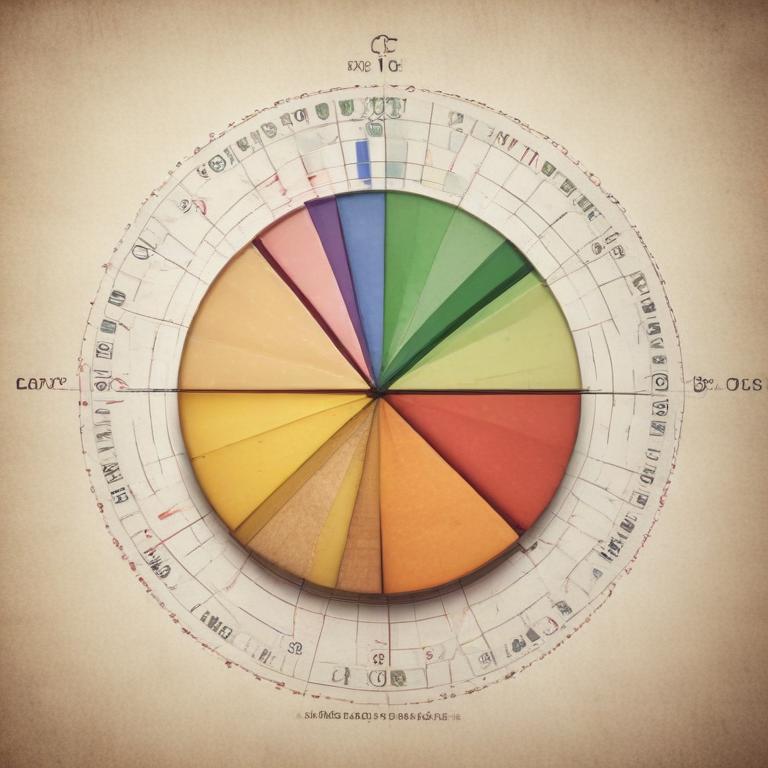
- pie chart: 饼图
- bar chart: 柱状图
其他语言 (Other Languages)
- 德语: Diagramm
- 法语: graphique
字母整体创意联想
单词 'charts' 中的 'c' 和 'h' 像是在绘制图表的两个支撑点,连接后面的字母形成一个完整的图表。
逐字母创意解读
中文谐音助记
‘charts’ 可以联想为‘查数据’,帮助记忆图表的含义。
相关电影/名言
"In the world of charts and graphs, numbers tell the story."
(在图表和数据的世界里,数字讲述着故事。)
- 《数据之海》(2021)
趣味知识/故事
图表的使用可以追溯到古代,早期的统计学家和地图制作者就开始利用图表来记录和展示信息,帮助人们更好地理解复杂的数据。
拓展信息
在现代,图表广泛应用于商业、教育和科学研究中。通过图表,信息可以以更直观的方式呈现,帮助观众快速抓住要点。
'charts' 还可以作为动词使用,表示绘制图表或记录数据的过程。
网络参考 (More about "charts" from the Web)
Chart templates | Microsoft Create
Find customizable chart design templates for print, presentations, and more. Whether you use charts in research, in presentations, or to keep track of personal projects, there's a chart template that'll help you get started.
Graph Maker - Create online charts & diagrams in minutes | Canva
Magic Charts lets you present the most important information first, allowing your audience to gain insights with every interaction. Help your readers dig deeper into your data. With graphs, your audience can explore and learn more on their own, or use the filter feature to toggle between campaigns and marketing channels.
Create a chart from start to finish - Microsoft Support
Area charts can be used to plot change over time and draw attention to the total value across a trend. By showing the sum of the plotted values, an area chart also shows the relationship of parts to a whole. Types of area charts. Area Shown in 2-D format, area charts show the trend of values over time or other category data. As a rule, consider ...
更多图片 (charts More Images)